
Key Takeaways
Choose the gear material by service conditions, required precision, and validated gear-level durability—not material labels alone.
- Use PM gears for high-volume, steady-load applications: near-net shaping delivers 90–98% material utilization and can reduce manufacturing costs by 12–38%.
- Address PM porosity through surface rolling and controlled heat treatment; densification and compressive stress can match or exceed wrought-gear fatigue performance.
- Specify alloy, density, carburizing, geometry, finish, lubricant, load, and runout criteria before comparing fatigue or wear data between gear materials.
- Select wrought steel for shock loads, specialized alloys, or DIN 10-or-tighter accuracy, where full density and consistent toughness provide greater design margin.
- Require actual gear-level bending and contact-fatigue tests from suppliers; roller tests cannot reproduce pore-driven cracking, sliding, and flank-spalling behavior.
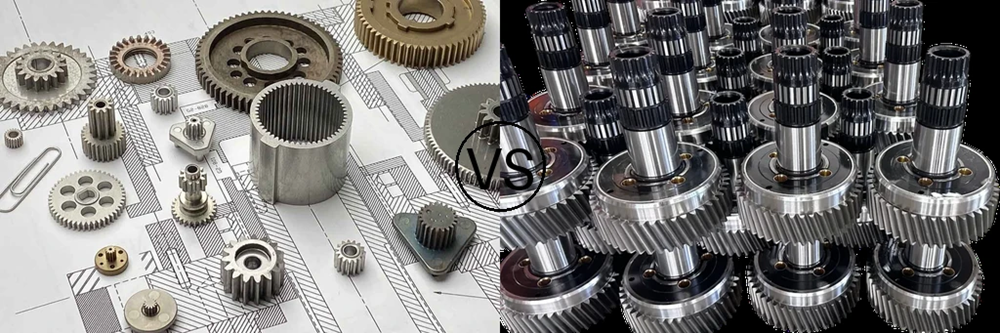
Sintered Steel vs. Wrought Steel Gears: Materials and Production
Pressed and Sintered Powder vs. Cut Wrought Steel Blanks
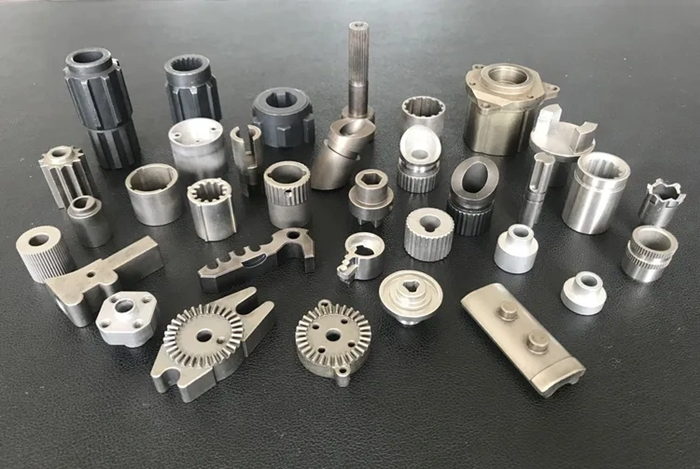
Powder metallurgy gears begin with metal powder that manufacturers mix, compact into a near-net-shape form, and sinter at controlled temperatures. Wrought steel gears start as solid steel blanks, and cutting, hobbing, or grinding creates the tooth profile. The PM route uses pressing and sintering to produce complex geometries, such as external and internal splines, in one compaction step. This removes most machining operations. Wrought gears require multiple cutting processes to create the same features.
Material utilization drives the economic difference. PM components use up to 98% of the raw material in the final part. Wrought gear production creates chips and scrap during each cutting operation. High-volume automotive applications can achieve lower unit production costs with PM. Wrought steel remains necessary for extreme precision or specialized alloys.
Porous PM Steel vs. Near-Full-Density Wrought Steel
Conventional PM technology produces components with 5-15% inherent porosity. A gear pressed to 7.2 g/cm³ has approximately 12-17% void volume. Wrought steel reaches near-full density with minimal voids. This difference in density directly affects mechanical properties.
PM materials contain interconnected pores that extend to the surface or closed holes within the part. Structural PM parts typically reach relative densities of 80% to 95%. Wrought steel forgings exceed 99% relative density. PM parts can narrow this gap through powder forging, rolling densification, or hot isostatic pressing, which removes porosity.
Advanced PM routes can further close the density gap. Double pressing followed by canister-less HIP produces nearly pore-free material if the surface’s original density reaches at least 7.4 g/cm³. The process requires closed porosity because it prevents the HIP process media from entering the material. A demonstrator gear made through this route achieved full density, although fatigue testing showed lower strength than reference case-hardening steel 17NiCrMoS6.
Porosity affects more than strength. Thermal conductivity falls in line with increasing porosity. Machining operations can then create thermal effects that speed up tool wear during dry cutting. Common PM components sintered at 6.6-7.0 g/cm³ have pore sizes below 50 µm. Machining compresses surface pores and creates a deformed layer 50-100 µm thick.
Why Alloy Grade and Heat Treatment Must Be Specified
PM and wrought gears designed for like applications use different material compositions. A wrought gear might use 16MnCr5 steel with 1-1.3% manganese and 1.1% chromium. A PM gear with comparable duty uses Astaloy Mo with 1.5% molybdenum and 0.3% carbon. Standard wrought gear steels do not work well in the PM process. High-performance PM steels need different alloying strategies to achieve similar hardening profiles.
Both materials undergo case carburizing to achieve an HV0.1 surface hardness of 800. This heat treatment creates a hard surface layer while retaining core toughness. Carburizing followed by quenching and tempering applies to both wrought and PM gears. PM material’s porous structure can allow deeper carbon penetration unless process parameters remain controlled.
Sintering atmosphere and temperature directly affect the final properties. A typical PM gear sintering schedule runs at 1120-1130°C for 20-45 minutes in an atmosphere of 90% nitrogen and 10% hydrogen. Cooling rate also matters. Normal cooling at 0.5°C/s produces different microstructures than rapid quenching. Two gears made from the same powder mix can deliver inconsistent performance if these parameters are not specified.
How to Compare Gear Fatigue and Wear Tests
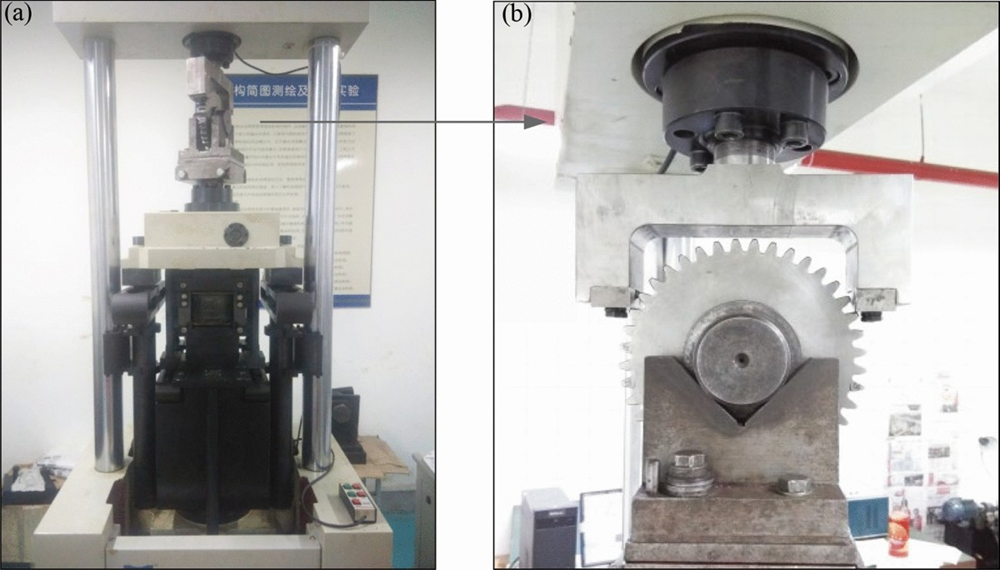
A valid comparison between sintered steel gears and wrought steel gears requires similar test protocols. A bending test on one material and a contact test on another produces meaningless results. Test geometry, loading patterns, surface condition, and oil chemistry must remain constant for both material types.
Match Tooth Shape, Surface Finish, Load, and Lubrication
Surface roughness directly affects the onset of rolling contact fatigue. A ground surface with Ra = 0.9 μm and Rsk = 0.24 creates different contact stress distributions than a shot-peened surface with Ra = 0.63 μm and Ssk = -0.11. The lambda ratio, defined as minimum film thickness divided by composite surface roughness, determines the lubrication regime. Tests at λ < 0.5 represent severe boundary lubrication conditions that are common in off-highway applications. Results from a λ = 2.0 test do not match those from a λ = 0.4 test.
Lubricant selection matters just as much. Phosphonium-based ionic liquids with half the viscosity of SAE 75W-90 gear oil showed better surface protection despite their lower viscosity. Mineral oil for one material and synthetic oil for another introduce variables that can mask differences in material performance. The slide-to-roll ratio (SRR) adds further complexity. Negative slip on the pinion dedendum produces higher tensile stresses at the contact inlet than positive slip at the addendum. Test results from different tooth positions therefore cannot be compared directly.
Tooth-Root Bending Tests vs. Rolling Contact Tests
Single-tooth bending fatigue tests apply a load to one tooth through a static or oscillating anvil. The specimen experiences pure bending stress at the root filet and does not experience the sliding contact forces found in meshing gears. Single-tooth tests use four teeth per specimen: one test tooth, one reaction tooth, and two untested intermediate teeth. A 28-tooth gear therefore provides seven test sections.
Rolling contact tests replicate actual meshing conditions. Twin-disk machines press two counter-rotating disks together. One disk has a flat profile, while the other has a crowned profile with a 65 mm radius. The point-contact condition generates contact pressures of up to 2 GPa with controlled slip ratios. This method allows micropitting and spalling to develop under conditions that resemble gear tooth flanks. Bending tests predict root failures, while contact tests predict surface distress.
S–N Curves: Stress, Cycles, and Failure Probability
An S-N diagram plots applied stress on the vertical axis and cycles to failure on the horizontal axis. The trend line through scattered data represents a 50% failure probability. Ferrous materials often show an endurance limit where the curve becomes horizontal. This suggests a stress level below which failures stop, whatever the cycle count. Non-ferrous materials show continuously declining slopes without a true endurance limit.
Statistical analysis with Dixon and Mood methods calculates the mean fatigue limit and standard deviation from staircase test sequences. Three consecutive runouts at a given stress level define the endurance limit. For design, the B1 life, or 99% survival, lies about 2.33 standard deviations below the mean. A baseline material with a 1000 MPa mean endurance limit and a 100 MPa standard deviation yields 767 MPa at 99% reliability.
Runout Limits: 10 Million vs. 15 Million Cycles in the Cited Studies
Bending fatigue studies often define runout at 5 million cycles for case-hardened materials because S-N curves usually show the fatigue-limit knee at 3 million cycles. Other studies extend runout to 10 million cycles. Test-duration constraints drive this choice. A test frequency of 1000 Hz accumulates 10^8 cycles in 27.8 hours, while 10^9 cycles requires 11.6 days.
Contact-fatigue protocols differ. Micropitting tests run each load stage for one million cycles on the faster disk and increase the load every 8.3 hours until cumulative mass loss exceeds 8 mg per stage. Runout in these tests means completing the load sequence without exceeding the damage threshold rather than reaching a fixed cycle count. Studies must specify whether they use a 5, 10, or 15 million-cycle runout when comparing reported endurance limits between sintered gears and wrought steel alternatives.
Bending Fatigue Strength of PM Gears vs. Wrought Gears
Tooth-Root Stress: Pore Defects vs. Filet Stress Concentration
Fatigue cracks in sintered steel gears start at the largest pore within the stressed volume rather than at the root filet’s geometric stress concentration. Statistical analysis of pore distribution in PM materials shows a strong link between fatigue limit and the largest pore size. Fracture mechanics models treat a pore as a sharp notch and relate pore area to fatigue strength through the stress intensity factor range. A sinter-hardened chromium steel with a density of 7.0 g/cm³ had a median largest pore area of 2,000-2,500 µm² in the critical volume. Wrought steel gears have negligible porosity, so stress concentrates at the designed filet radius, where cracks grow along predictable paths.
The relationship between fatigue strength and pore size follows σw ∝ A^n, where A represents pore area and n is an experimentally determined exponent. Linear elastic fracture mechanics predicts n = -0.25 when crack initiation dominates. Tests on sinter-hardened chromium steel showed n = -0.29, which is close to the theoretical prediction. Wrought gears avoid this porosity penalty, although machining defects or heat-treatment distortion can create comparable stress risers.
PM Hardening Study: 192 vs. 162 MPa at 10,000 Cycles
Experimental bending-fatigue tests on Distaloy AB sintered gears showed that added hardening moderately improved strength at low cycle counts. Specimens that were sintered and then hardened reached a fatigue strength of 192 MPa at 10^4 cycles. Specimens that received only sintering reached 162 MPa at the same cycle count. The hardening treatment improved strength by about 15%.
The benefit declines as the cycle count rises. Both material conditions reached similar fatigue strength near 10^6 cycles. This occurs because hardened specimens have greater original strength but lower ductility, which limits resistance to crack propagation at lower stress levels. Sintered-only specimens retain more ductility and form wider plastic zones at crack tips. These zones slow crack growth during extended cycling.
Why PM Hardening Results Do Not Establish Wrought Steel Parity
Surface densification rather than heat treatment alone allows PM gears to match wrought steel’s bending performance. Case-hardened PM gears with surface densification and a 7.4 g/cm³ core density exceeded the tooth-bending strength of reference case-hardened 16MnCr5 wrought steel gears. PM gears without surface densification achieved only 850 MPa bending strength at a 7.6 g/cm³ core density, despite the high density. The surface-densified layer must extend far enough to contain Hertzian contact stresses and bending-stress gradients.
Finish-ground, hot-forged PM AISI 4620 gears achieved a 10% fatigue life that was about 70% of AISI 9310 wrought gears’ life. As-forged PM gears without finish grinding reached only 25% of the AISI 9310 life. Eight of eighteen ground PM gears sustained tooth fractures after surface fatigue. This indicates marginal fracture toughness caused by powder impurities. Wrought steel maintains consistent toughness across the tooth cross-section, while PM materials contain defects that can initiate fractures under combined bending and contact stresses.
Contact Fatigue and Wear Resistance: What the Tests Show
Small-Module PM Study: About 1,005 MPa Contact Fatigue Limit at 50% Reliability
Fe-based small-module gears made through powder metallurgy achieved a contact fatigue limit of about 1,005 MPa at 50% reliability under the Locati step-loading method. The test specimens went through carburizing at 750-900°C and tempering at 400°C, reaching a surface hardness of 437 HV0.1. Three repeated tests produced contact fatigue limits of 957.22, 1,023.77, and 1,032.61 MPa, with an average of 1,004.53 MPa. The gears expressed a mainly martensitic structure after tempering, with little difference between the tooth surface and core microstructures.
PM Contact Fatigue vs. 35CrMo, 40Cr, and 40CrNi2Mo Gears
A comparison of S-N curves at 50% reliability showed that PM small-module gears had a much longer contact fatigue life than conventional wrought 35CrMo and 40Cr gears. Under the same contact stress, PM gears outlasted both wrought materials. Wrought 40CrNi2Mo gears performed slightly better, but, as PM gear life was marginally lower than that of this nickel-molybdenum alloy at equivalent stress levels. The contact fatigue limit showed a similar pattern: PM gears outperformed 35CrMo and 40Cr but remained below 40CrNi2Mo.
Surface Pitting vs. Subsurface Spalling in the Cited Gear Tests
Spalling was the main failure mode in PM small-module gears and affected more than 90% of failed specimens. Damage concentrated near the pitch line, where contact stress peaks during repeated gear meshing. Surface-densified PM materials under rolling-contact conditions failed only through pitting, and the damage morphology closely resembled that of wrought-steel reference materials. Two crack types appeared: small surface cracks and longer subsurface cracks parallel to the surface. All cracks stayed within the densified zone. Subsurface cracks developed into pitting damage, while surface cracks grew into the material at about 30° because of shear stresses and -24% sliding.
Sliding Wear: Surface Roughness, Oil Film, and Grease Breakdown
The original tooth surface roughness, Sa, fell from 0.83 μm to 0.45 μm after 600,000 cycles, a 45.8% reduction during the running-in stage. Sq also decreased from 0.63 μm to 0.32 μm, a 49.2% reduction. The tooth surface then became relatively stable because the lubricating oil film limited wear and roughness changes. Grease lubrication added complexity. High-consistency greases used in dip lubrication produced much higher wear rates than spray lubrication with the same grease because channeling promoted lubricant starvation.
Why Roller Tests Alone Cannot Predict Gear Flank Life
Roller tests do not capture the geometric complexity or sliding conditions of actual gear contacts. The zigzag spalling morphology on PM gear tooth flanks was much rougher than the surfaces reported for traditional wrought-steel gears in roller studies. Pores play a key role in crack initiation and propagation in PM gears. Micro-cracks initiate at pore edges and expand among disordered pores because cyclic loading creates stress concentrations. This three-dimensional crack network cannot be reproduced in two-roller test geometries, where stress fields stay uniform across the contact width.
Why Porosity and Surface Rolling Change Powder Metal Gear Performance
Sharp Pores: Early Crack Initiation and Long Crack Growth
Sharp pore edges in sintered steel gears concentrate stress and cause cracks to form earlier than smooth features. Two crack types appear during rolling contact: small surface cracks that propagate into the material at about 30°, and longer subsurface cracks that run parallel to the surface. Both types stay within areas that contain residual porosity. Subsurface cracks lead to pitting damage as they grow through the porous structure and connect nearby voids along paths of least resistance.
Surface Rolling: Fewer Large Pores Near the Tooth Flank
Radial rolling compresses the gear tooth surface and drives material flow to eliminate or close pores to a controlled depth. Spur gears reached densification of about 0.5 mm on the flank. Helical gears showed deeper densification in the root region, reaching 0.4 to 0.5 mm, while flank densification reached only 0.2 mm in both tested material variants. The densified zone reaches full or near-full density at the surface, while the core remains unchanged. The density gradient follows a predictable pattern and falls to 98% of theoretical density at the defined densification depth, based on image analysis.
Compressive Residual Stress: How Rolled PM Gears Can Exceed Wrought Gears
Surface rolling creates compressive residual stresses that counter applied tensile loads during gear operation. Thread rolling on 42CrMo4 steel showed peak compressive stress of about -700 MPa to depths greater than 1000 μm. Deep rolling produced maximum compressive stress of -600 MPa at a depth of 300 μm. Cut threads, by contrast, showed minimal residual stress. Surface-densified PM gears developed stress distributions comparable to wrought steel under the same Hertzian pressure, and subsurface stress peaks occurred at similar depths. A full-density surface combined with compressive stress allows rolled PM components to match or exceed wrought steel performance under rolling contact conditions.
Carburizing and Quenching: Surface Hardness vs. Core Toughness
Case hardening creates distinct property zones. Vacuum-carburized helical gears reached 760 HV0.1 surface hardness with a 0.5 mm case depth. Gas-carburized variants reached 850 HV0.1 surface hardness at a 0.4 mm case depth. The densified layer limits gas-phase carbon transport and forces diffusion-controlled carburizing, as with solid steel. This process produces consistent case development with compressive residual stresses of up to 300 MPa. Core regions retain lower hardness to maintain toughness and prevent brittle fracture under shock loads.
Choosing Sintered or Wrought Gears for the Required Service Life
Steady Loads vs. Shock Loads: Compare Root and Flank Limits
The application duty cycle determines whether sintered steel gears can replace wrought alternatives. Steady, predictable loads allow designs to meet both the contact fatigue limit near 1,005 MPa and the bending fatigue endurance strength. Shock loads or variable torque patterns just need an evaluation of low-cycle fatigue behavior because PM materials offer less advantage under these conditions. Surface-densified PM spur gears achieved a 33 kN tooth-root bending endurance, exceeding the 31 kN result of solid steel reference gears. Surface-densified helical gears reached 9.4 kN endurance compared with 10 kN for 16MnCr5 wrought steel, leaving a 6% gap. Both limits must remain within the operating envelope.
Tooth Accuracy and Noise: Conditions Where Optimized Rolling Can Replace Grinding
Surface rolling improves dimensional consistency and densifies the tooth. Diameter-over-balls scatter decreased from ±0.0225 mm after hobbing to ±0.0031 mm after rolling. Rolled helical gears achieved DIN quality 8 or better for profile form deviation. Spur gears met DIN 8 requirements except for one parameter, which fell within DIN 9 tolerance. Grinding remains necessary if specifications just need DIN quality 10 or tighter.
Production Cost: PM Tooling vs. Wrought Steel Machining
PM routes showed manufacturing costs 12–38% lower than conventional wrought steel processing in the analyzed scenarios, although PM equipment acquisition costs were nearly three times higher. Surface densification added costs comparable to pressing and sintering, substantially below powder-forging costs. PM achieved material utilization of 90–97%, compared with 40–60% for machined wrought gears.
Supplier Approval: Require Gear-Level Fatigue and Wear Data
Roller tests cannot fully represent gear contact conditions because they lack geometric complexity and use simplified sliding. Actual gear testing showed zigzag spalling morphology and three-dimensional crack networks among pores that two-roller geometries cannot replicate.
Comparison Table
Comparison Table: Sintered Steel vs. Wrought Steel Gears
| Attribute | Sintered Steel (PM) Gears | Wrought Steel Gears |
|---|---|---|
| Production Method | Metal powder is mixed, compacted into a near-net shape, and sintered at 1120-1130°C for 20-45 minutes | Solid steel blanks are cut or shaped through hobbing or grinding to form the tooth profile |
| Material Density | 5-15% inherent porosity; typical density of 7.2 g/cm³ (80-95% relative density) | Near-full density; >99% relative density with minimal voids |
| Material Utilization | Up to 98% of raw material becomes part of the final component; 90-97% utilization | 40-60% utilization; cutting operations produce chips and scrap |
| Porosity Characteristics | 12-17% void volume at 7.2 g/cm³; pore size <50 µm | Negligible porosity |
| Bending Fatigue Strength (10,000 cycles) | 192 MPa with hardening; 162 MPa when sintered only | Surface-densified PM exceeded the 16MnCr5 wrought steel reference |
| Bending Endurance (Surface-Densified) | Spur gears: 33 kN; helical gears: 9.4 kN | Spur gears: 31 kN; helical gears: 10 kN (16MnCr5) |
| Contact Fatigue Limit (50% reliability) | ~1,005 MPa for Fe-based small-module gears | 35CrMo and 40Cr: lower than PM; 40CrNi2Mo: slightly higher than PM |
| Surface Hardness (After Carburizing) | 760-850 HV0.1 after vacuum or gas carburizing; 437 HV0.1 when tempered | 800 HV0.1 after case carburizing |
| Case Depth | 0.4-0.5 mm | 0.5 mm, typical for case-hardened gears |
| Primary Failure Mode | Spalling accounts for >90% of failures; cracks start at pore edges | Pitting; cracks start at geometric stress concentrations |
| Surface Densification Depth | Spur gears: ~0.5 mm on the flank; helical gears: 0.2-0.5 mm | Not applicable because the material is already at full density |
| Compressive Residual Stress | Up to 300 MPa after carburizing; comparable to wrought steel after surface densification | -600 to -700 MPa after deep or thread rolling |
| Dimensional Accuracy (After Rolling) | DIN quality 8-9; diameter scatter of ±0.0031 mm | DIN quality 10 or tighter with grinding |
| Manufacturing Cost | 12-38% lower than wrought steel processing | Higher because of multiple machining operations |
| Equipment Acquisition Cost | Nearly 3× higher than conventional equipment | Lower original investment |
| Typical Alloy Examples | Astaloy Mo (1.5% Mo, 0.3% C); Distaloy AB; Fe-based PM steels | 16MnCr5 (1-1.3% Mn, 1.1% Cr); 35CrMo; 40Cr; 40CrNi2Mo; AISI 9310 |
| Surface Roughness (Initial/After Running-in) | Sa: 0.83 µm → 0.45 µm, a 45.8% reduction after 600,000 cycles | Not specified in this piece |
| Thermal Conductivity | Decreases linearly as porosity increases | Higher because of full density |
| Best Applications | High-volume automotive applications with steady, predictable loads and cost-sensitive requirements | Applications requiring extreme precision, shock-load resistance, or specialized alloys |
Conclusion: Optimize Your Gear Design with JHMIM Manufacturing Expertise
The performance gap between sintered steel gears and traditional wrought steel gears is no longer absolute. Surface-densified powder metal (PM) gears can achieve contact fatigue limits around 1,005 MPa and bending endurance near 33 kN, matching or exceeding wrought steel under steady cyclic loads while reducing high-volume production costs by 12% to 38%.
Wrought steel remains the default choice for applications subject to extreme shock loads, specialized alloy specifications, or DIN Quality 10 and tighter tolerances. However, accurate material selection depends on actual gear-level fatigue testing rather than simplified lab roller tests. Factors like pore distribution, three-dimensional micro-crack propagation, and surface densification depth must be evaluated directly against your load profile.
At JHMIM, we specialize in high-density powder metallurgy and metal injection molding for custom spur, helical, and planetary gear systems. Our engineering team integrates advanced compaction, sintering, and secondary surface-densification controls to ensure your components hit rigorous fatigue and dimensional targets.
Evaluating sintered vs. wrought steel for your gear assembly? Contact JHMIM’s technical sales team today or submit your 3D CAD drawings for a comprehensive DFM and cost-saving feasibility analysis within 24 hours.
Frequently Asked Questions (FAQs)
Q1. How do sintered steel gears differ from wrought steel gears?
Sintered gears are manufactured by compacting and sintering metal powders, forming a porous structure unless densified. Wrought steel gears are machined from solid wrought bar stock or forgings, resulting in near-100% density and continuous grain flow.
Q2. Can sintered steel gears match wrought gears in bending fatigue strength?
Yes. Surface-densified PM gears can match or exceed standard wrought gears in tooth-root bending fatigue. Surface densification closes open surface pores and introduces compressive residual stresses, preventing crack initiation under cyclic bending loads.
Q3. Which gear material offers better contact fatigue resistance?
Contact fatigue resistance depends on density and heat treatment. High-density sintered gears (especially surface-rolled grades) can outperform wrought 35CrMo and 40Cr steels under rolling contact, though premium quenched-and-tempered 40CrNi2Mo wrought steels still offer higher ultimate load capacity.
Q4. How does surface rolling improve sintered gear durability?
Surface rolling collapses surface and subsurface porosity in the active tooth flank and root area to near-full density. This layer resists pitting, micropitting, and subsurface fatigue cracks, raising fatigue endurance up to 600,000+ cycles without failure.
Q5. When should you choose sintered gears instead of wrought gears?
Choose sintered steel gears for medium-to-high volume production runs where cost reduction (12–38%) and complex geometry integration (e.g., dual-gear clusters) are essential. Choose wrought steel gears for severe impact/shock loading, low-volume prototypes, or sub-DIN 10 high-precision gearboxes.