
SPC has changed manufacturing quality control for decades and helped companies worldwide cut costs through systematic process monitoring. Statistical Process Control (SPC) offers a quick way to reduce waste, scrap, rework, and quality issues in production facilities. Injection molding continues to see rising demand across the United States. Many manufacturers now use SPC techniques to spot process changes before defective parts appear.
SPC stands for Statistical Process Control – a systematic approach that achieves process stability by reducing variability. The SPC definition includes monitoring, optimizing, and controlling key parameters like temperature, speed, pressure, time, and position throughout production cycles. Statistical process control goes beyond basic monitoring. It focuses on pattern recognition and trend analysis to maintain process integrity at every production stage. Companies that use SPC in manufacturing see clear benefits – lower scrap rates, better part consistency, and reduced quality costs. This piece shows how SPC’s role in manufacturing leads to better quality control for metal injection molding operations.
Understanding SPC in Metal Injection Molding
Statistical Process Control is a proven methodology that has evolved to become vital in modern manufacturing. Walter Shewhart at Bell Laboratories created SPC in the 1920s, and it has become the lifeblood of quality management systems worldwide.
What does SPC stand for in manufacturing?
SPC stands for Statistical Process Control in manufacturing contexts. This methodology uses statistical techniques to monitor and control production processes. The concept really took off during World War II when American facilities used it extensively to produce ammunition and weapons while maintaining quality standards and safety. American interest waned after the war, but Japanese manufacturers embraced these techniques. This eventually pushed American industries to bring back SPC in the 1970s to stay competitive.
SPC definition and its role in quality control
The formal SPC definition includes applying statistical tools and procedures to monitor process behavior, find issues in internal systems, and solve production problems. SPC is often used interchangeably with Statistical Quality Control (SQC), though SQC has acceptance sampling while SPC doesn’t.
SPC’s main goal in quality control is to tell the difference between two types of variations:
- Common cause variation: These are normal fluctuations that happen in any process under standard operating conditions
- Special cause variation: These are abnormal variations that come from specific, identifiable factors that we must address right away
This difference matters because each type requires its own response. Process improvements help with common cause variations, while special causes require immediate investigation and fixes.
Statistical process control meaning in metal molding
In metal injection molding, statistical process control goes beyond simple quality monitoring. SPC forms the foundations for spotting unwanted variations before they create defective parts. The process tracks key parameters like injection pressure, melt temperature, and dimensional accuracy over time.
Metal injection molding processes naturally show variations due to material properties, machine performance, and environmental conditions. SPC helps us know if these variations are acceptable or need fixing. This informed approach helps manufacturers turn reactive quality control into proactive process management.
SPC in metal injection molding helps manufacturers maintain consistent quality, reduce waste, and improve operational efficiency. Engineers can schedule preventive maintenance by spotting patterns and trends early instead of waiting for catastrophic failures that lead to scrapped products and unplanned downtime.
Key Parameters to Monitor in SPC
Process control works best when you measure the right parameters at the right time. Metal injection molding needs SPC implementation that tracks variables directly affecting part quality and consistency.
Injection pressure and melt temperature tracking
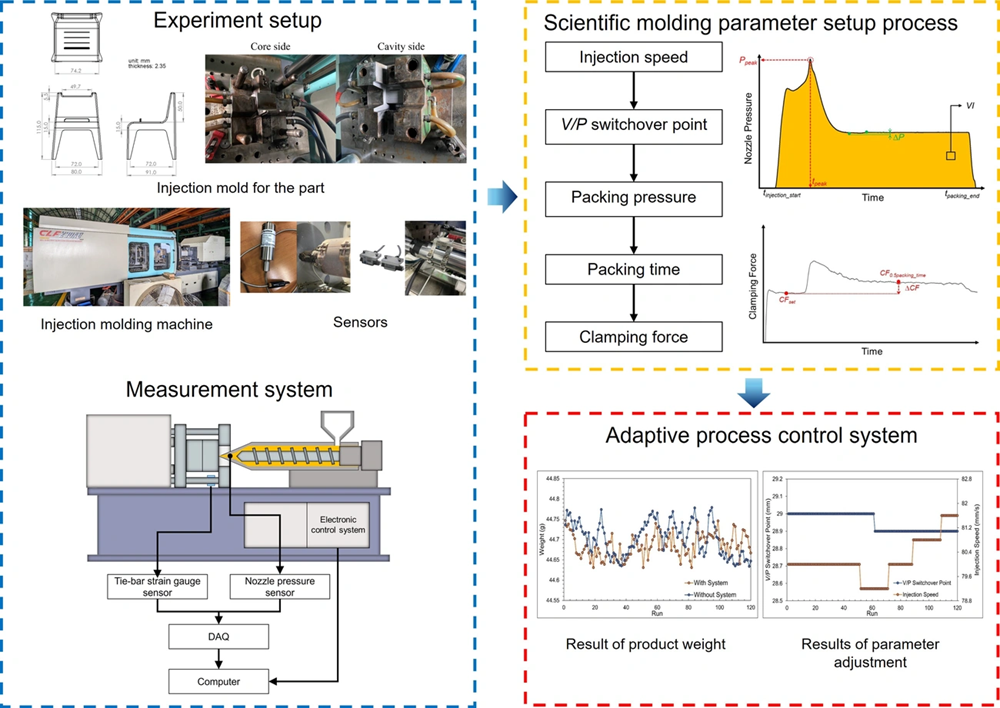
Injection pressure is a vital indicator of material flow behavior and machine condition. Measurements taken directly in the injection mold give the best process insights. Post-gate sensor positioning helps visualize mold filling for characteristics that cavity filling affects by a lot. Melt temperature monitoring shows thermal energy changes that predict part quality. Modern systems measure 157 times per second during injection and calculate metrics that associate with final part quality.
Monitoring part weight and dimensional accuracy
Part weight tells us a lot about process stability. Quality parameters can change by a lot with weight variations as small as 0.02g. Dimensional accuracy plays an equally vital role because it will give a proper fit between components and maintains structural integrity. Manufacturers should track features that need tight tolerances and meet functional requirements for specific applications.
Cycle time and mold temperature consistency
Cooling takes up 60-80% of injection molding’s total cycle time, making it perfect for optimization. Cycle consistency tracking warns about developing problems early. Basic SPC implementation with X-bar/R charts catches process drift before quality drops. Mold temperature plays a key role in crystallinity, shrinkage, and surface finish quality. You need to measure actual mold cavity temperature after it stabilizes, not just cooling water temperature.
Measurement system validation and R&R studies
Measurement systems need validation through Gage R&R (Repeatability and Reproducibility) studies before SPC data becomes reliable. These studies review:
- Repeatability: Variation from the measurement device itself
- Reproducibility: Variation between different operators
Good measurement systems should add less than 10% of specification tolerance. Industry standards say total Gage R&R contribution under 10% works well, while 10-30% might work depending on what you need.
SPC Tools and Charts for Process Control
Statistical tools are the foundations of any working SPC implementation in metal injection molding. The right chart type depends on your data characteristics and what you need to monitor.
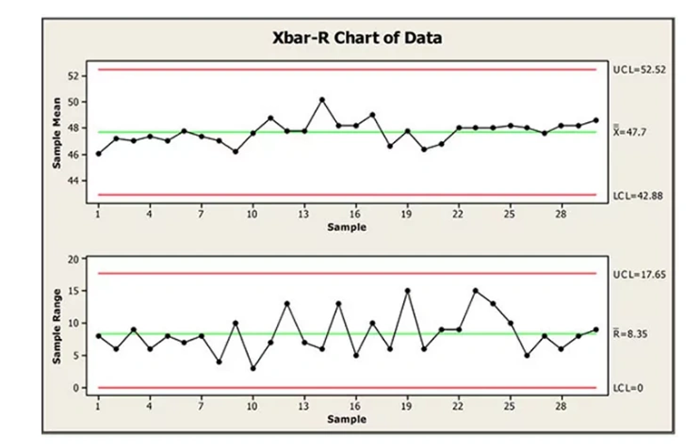
X-bar and R charts for continuous data
X-bar and R charts serve as the backbone of SPC for continuous measurements in metal injection molding. Operators measure 3-5 parts at regular intervals. The X-bar chart tracks sample averages to spot process changes. The R chart monitors sample ranges to check consistency. These charts work together to provide complete process monitoring and catch both centering changes and variation increases.
I-MR charts for low-volume production
Individual and Moving Range (I-MR) charts work best with single measurements instead of samples. These charts are especially useful when you have:
- Low-volume or prototype production
- Expensive or destructive testing
- Continuous process measurements like melt temperature
P-charts and U-charts for defect tracking
P-Charts monitor defect proportions in samples and work well for pass/fail inspections. U-Charts track defect counts in parts that can have multiple defects. These charts help track cosmetic issues, but don’t give as much insight as variable data charts.
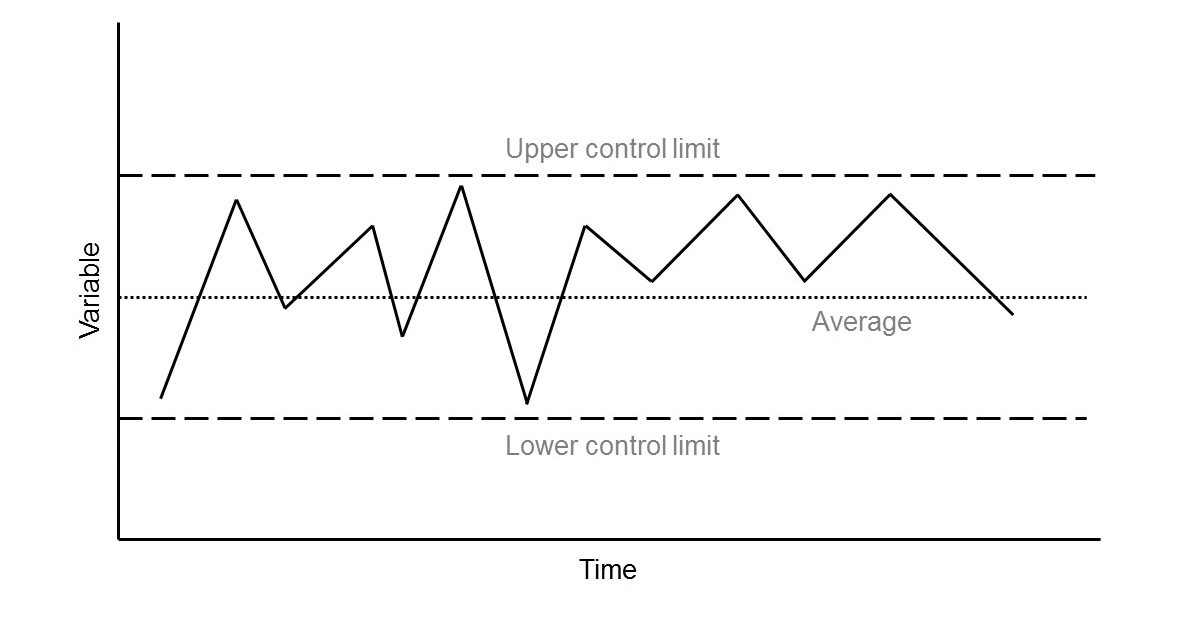
Using control limits to detect special cause variation
The process itself determines control limits, which are set at +3 standard deviations from the mean. Control limits show expected process performance, unlike specification limits. Any points outside these limits indicate special causes that need immediate attention.
Capability indices: Cp and Cpk explained
Process Capability Indices help calculate how well a process meets specifications. Cp measures potential capability by showing the space between process variation and specification limits. Cpk shows actual capability by factoring in process centering. A process becomes capable with a good margin for variation at a Cpk of 1.33 or higher.
Implementing SPC in Metal Injection Molding
A well-laid-out methodology helps manufacturers succeed with SPC in metal injection molding. Let’s break down how companies can combine these statistical tools smoothly into their operations.
Step-by-step SPC setup for molding operations
The first step is to set clear goals for SPC implementation. These goals might include better product quality, less waste, or optimized processes. The next step involves finding key processes that affect product quality a lot, especially where variations often show up. The final step requires building a team from production, quality assurance, and engineering departments to push the SPC initiative forward.
Defining critical-to-quality (CTQ) characteristics
Product specifications help identify CTQ characteristics. Design engineers, quality teams, and customers need to work together to set the right priorities. Each critical output requires understanding which process inputs have the strongest effect. Teams should document these connections in a cause-and-effect matrix.
Establishing baseline data and control limits
Teams should collect 25-30 samples in a row during normal production to create baseline data. This data helps calculate the original control limits and shows current process capability. Control limits usually sit at ±3 standard deviations from the process average. The baseline should come from a stable period when the process maintains statistical control.
Training operators and engineers on SPC response
Every team member needs complete training on SPC principles and tools. Operators should spot control chart patterns and know response steps. Technicians must keep measurement systems running and look into special causes. Recent examples of caught problems show SPC’s value in ground applications.
Using SPC software for immediate monitoring
Modern SPC uses software that automates data collection, chart creation, and analysis. These systems give immediate visual process updates with custom alerts for quality changes. The best solutions come with role-based dashboards. Operators see their machine’s current performance, engineers use detailed analysis tools, and managers track capability trends across operations.
Conclusion
Statistical Process Control (SPC) is a crucial method metal injection molding manufacturers use to maintain quality and cut waste. This piece shows how SPC turns reactive quality management into proactive process optimization. The system monitors critical parameters systematically.
SPC implementation needs close monitoring of key variables like injection pressure, melt temperature, part weight, and dimensional accuracy. These parameters give valuable insights about process stability and performance when tracked properly. Cycle time and mold temperature consistency can signal potential problems before they turn into defects.
Teams need the right statistical tools that match their production environment to deploy SPC effectively. X-bar and R charts suit continuous data in standard production. I-MR charts work better for low-volume scenarios. Teams can spot the difference between common variations and special causes that need quick action by setting proper control limits.
Companies see major benefits when they take a structured approach. The process starts with clear objectives. Teams identify critical-to-quality characteristics, set baseline data, and learn proper response procedures. Modern SPC software makes this better with live monitoring and automated alerts.
SPC does more than just find defects. Companies that use statistical process control see real results. They cut scrap rates, make more consistent parts, spend less on quality, and run more efficiently. Best of all, SPC helps manufacturers fix problems before they affect product quality. This keeps customers happy while making the best use of production resources.
Key Takeaways
Statistical Process Control (SPC) transforms metal injection molding from reactive quality management to proactive process optimization, helping manufacturers reduce waste and maintain consistent part quality.
• SPC monitors critical parameters like injection pressure, melt temperature, part weight, and dimensional accuracy to detect process variations before defects occur.
• Different chart types serve specific needs: X-bar/R charts for continuous data, I-MR charts for low-volume production, and P/U charts for defect tracking.
• Control limits distinguish variation types: Common cause variations need process improvements while special causes require immediate investigation and correction.
• Successful implementation requires structure: Define CTQ characteristics, establish baseline data, train operators, and use real-time SPC software for monitoring.
• Measurement system validation is essential: Gage R&R studies ensure measurement systems contribute less than 10% of specification tolerance for reliable data.
When properly implemented, SPC enables manufacturers to schedule preventive maintenance rather than react to failures, ultimately reducing scrap rates, improving part consistency, and lowering quality costs while maintaining customer satisfaction.
FAQs
Q1. What is the primary purpose of Statistical Process Control (SPC) in manufacturing? SPC is a methodology used to monitor, optimize, and control critical parameters in production processes. It helps manufacturers reduce waste, minimize defects, and maintain consistent product quality by identifying process variations before they result in defective parts.
Q2. How does SPC differentiate between types of process variations? SPC distinguishes between common cause variations (normal fluctuations inherent to the process) and special cause variations (abnormal changes requiring immediate attention). This distinction allows manufacturers to respond appropriately to different types of process changes.
Q3. What are some key parameters monitored in metal injection molding using SPC? Critical parameters in metal injection molding include injection pressure, melt temperature, part weight, dimensional accuracy, cycle time, and mold temperature consistency. Monitoring these factors helps ensure product quality and process stability.
Q4. What types of charts are commonly used in SPC for metal injection molding? Common SPC charts include X-bar and R charts for continuous data in standard production, I-MR charts for low-volume scenarios, and P-charts and U-charts for tracking defects. The choice of chart depends on the specific data characteristics and monitoring objectives.
Q5. How can manufacturers effectively implement SPC in their operations? Successful SPC implementation involves defining critical-to-quality characteristics, establishing baseline data and control limits, training operators and engineers on SPC principles, and utilizing SPC software for real-time monitoring. This structured approach helps transform reactive quality management into proactive process optimization.