Key Takeaways
Understanding particle size distribution in MIM is crucial for achieving optimal part quality, mechanical strength, and production consistency.
• MIM requires ultra-fine powders (1-22 μm) compared to standard PM (50-100 μm) to achieve 95-99% density and superior surface finish • D50 values around 10 μm with D90 below 22 μm ensure proper mold filling and prevent defects in complex geometries • Spherical particles improve feedstock flow and packing density leading to better sintering outcomes and mechanical properties • Bimodal distributions increase packing density by 8.2% while reducing shrinkage and improving tensile strength up to 938 MPa • Laser diffraction analysis provides rapid, accurate measurement following ISO 13320 standards for quality control verification
Proper particle size control transforms raw powder into precision-engineered components, making measurement and specification adherence essential for MIM manufacturing success. 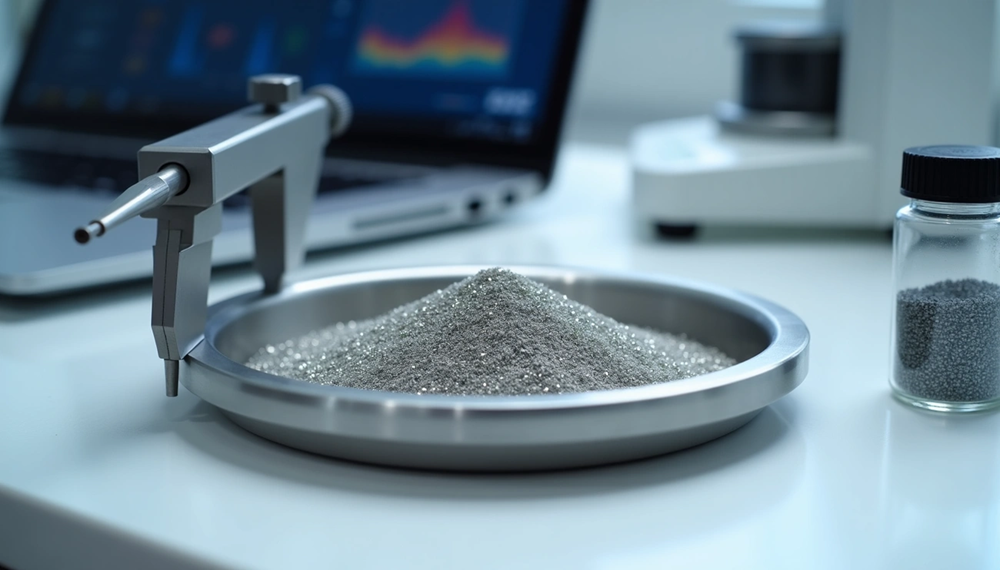 Powder particle size in MIM applications requires precision. Most processes just need powder with an average particle size of 20 μm or less, ranging from 1 to 10 μm. This specification exists because of a key manufacturing principle: powder size must be at least ten times smaller than the smallest dimension in the mold cavity. This ensures proper feedstock flow and microstructure filling. The particle size in microns influences final part density and mechanical strength directly. Knowing how to measure particle size distribution of powder using tools like powder particle size analyzers becomes necessary to control quality. This piece gets into how particle size μm specifications affect every stage of MIM production.
Understanding Powder Particle Size in MIM Fundamentals
What Makes MIM Powder Different from Standard Metal Powders
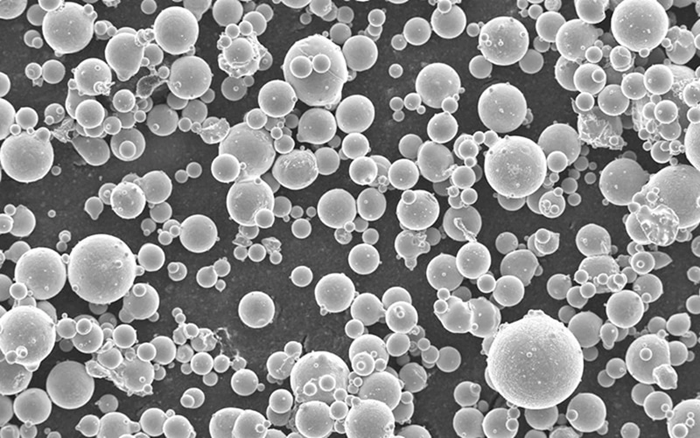
Metal injection molding distinguishes itself from conventional powder metallurgy through drastically different powder particle size specifications. Standard PM processes operate with powders ranging from 50 to 100 microns. MIM requires substantially finer particles between 2 and 15 microns. This size differential creates fundamental differences in final part characteristics.
The finer powder particle size in MIM translates to superior density levels. Parts produced through MIM achieve more than 95% density after sintering, with some applications reaching 95% to 99% density. Conventional PM parts reach a maximum of 92% density, with results falling between 85% and 93%. Lower porosity in MIM parts occurs because smaller particles create more uniform packing arrangements during the injection and sintering phases.
There’s another reason: surface quality. MIM exhibits surface roughness as fine as Ra 1 µm and eliminates the need for additional finishing processes that PM parts require. The finer powder particles fill mold cavities more completely, replicating intricate details and producing smoother surfaces from the sintering process. But these benefits come with increased production costs. Finer MIM materials demand more processing steps and energy to produce, making them more expensive than coarser PM powders.
Particle Size Range Requirements: 1-22 μm
Most MIM alloy powder specifications set particle size limits below 22μm. Industry standards call for a median size of 10 microns with a D90 value between 20 and 30 microns. This D90 specification means 90% of particles measure smaller than the stated threshold and ensures consistency in feedstock behavior.
Particle size in microns varies based on material requirements and application complexity. Hard alloys and hard metals require even tighter specifications, with particle sizes below 5μm. Gas atomization processes produce these fine powders, with air classification refining the distribution to achieve the 90%-22µm specification. Practitioners select between D90 values of 10 and 22 μm depending on feature size requirements for microstructured parts.
Feedstock viscosity responds to particle size μm changes. Powders with 10 μm particles cause slight viscosity increases compared to 22 μm particles, though the difference remains minimal. The more significant factor affecting viscosity involves powder content levels, which range from 60 to 65 vol.-% in most formulations. Smaller 10 μm particles ensure complete filling within microtextures in mold variations of all types, whereas 22 μm particles show decreased filling capabilities in features below 100 μm.
Why Spherical Particles Matter for Injection Molding
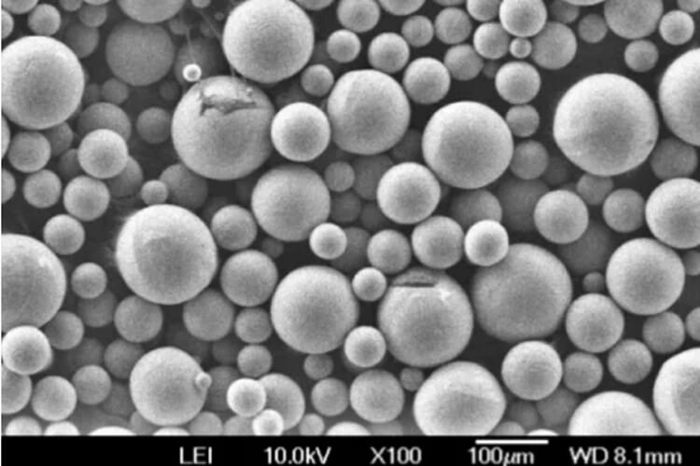
Particle morphology matters just as much as size in determining feedstock performance. Spherical particles deliver high conditioned bulk density and excellent flowability compared to irregular shapes. Particles that maintain spherical geometry exhibit better flow properties than irregular alternatives. This flowability becomes critical during injection molding, where feedstock must flow uniformly through complex mold geometries.
Gas atomization produces spherical particles with minimal satelliting, where smaller particles adhere to larger ones. High anti-satellite efficiency results in good flow properties and high packing density during the MIM process. Spherical shapes also promote better inter-particle friction and help parts maintain their shape during the debinding process. Surface purity requirements add another dimension to particle specifications, as clean particle surfaces prevent contamination during sintering and support optimal densification.
How Particle Size Distribution Controls Feedstock Behavior
D10, D50, D90 Values and How They Affect Mixing
Three percentile values quantify particle size distribution in MIM feedstock and describe the complete powder population. D50 represents the median particle size where half the particles measure smaller and half measure larger. D90 indicates the size below which 90 percent of particles fall, while D10 marks the threshold containing the smallest 10 percent. You can read these statistical parameters directly from cumulative particle size distribution curves and they help us learn about powder uniformity.
Real-life MIM powder distributions demonstrate how these values interact. A study on 17-4PH stainless steel examined three powder fractions with D50 values that ranged only 1.5 µm (from 10.2 to 11.8 µm), yet D90 values varied by 5.8 µm (from 21.9 to 27.7 µm). The 90% less than 22 µm fraction showed D10 of 3.6 µm, D50 of 10.2 µm, and D90 of 21.9 µm. Finer powder fractions serve special applications that require precise dimensions and thin-walled components with excellent surface finish, where superior molding characteristics become essential.
The relationship between powder size distribution and density matters a lot for feedstock preparation. Finer powders exhibit lower apparent and tap density due to increased inter-particle friction and inferior particle packing. This correlation affects how powders mix with binders and how the resulting feedstock behaves during injection directly.
Span Calculations for Distribution Width Assessment
Span calculations assess distribution width using the formula: Span = (D90 – D10) / D50. This normalized value indicates how far the 10 percent and 90 percent points spread apart relative to the midpoint. Particle size consistency improves and granularity becomes more uniform when span approaches zero.
Standards that require high particle size consistency by design display relatively small span values. Changes in span measurements between batches signal potential issues that require microscopic examination, as composition differences or quality variations may have occurred. Particle scientists often report D10, D50, and D90 alongside standard deviation or span calculations when they analyze distributions.
Powder Loading Capacity: 60-65 vol.% Optimization
Metal powders constitute 60 to 65 percent of feedstock volume, with the binder comprising the remaining 35 to 40 percent. This composition gives adequate flow properties while it maintains sufficient metal content for dense, strong final products after sintering. The 60-65 vol.-% metal powder provides final material properties, whereas the 35-40 percent polymer binder acts as a temporary carrier that enables injection molding.
Particle size distribution affects powder loading capacity and subsequent sintering outcomes. Research on spherical stainless steel powders revealed that the volume fraction of coarse particles decreases sintered density and hardness when increased due to more irregular particles. Tailoring powder size distribution can reduce raw powder costs without compromising sintered properties.
Binder-to-Powder Ratio Dependencies
The powder-binder ratio influences feedstock viscosity behavior. High powder-binder ratios create high viscosity with insufficient binder coverage. The binder system performs three engineered functions: it enables complete mold filling during injection, controlled removal during debinding, and adequate green strength for post-molding handling. Powder content levels between 60 and 65 vol.-% represent the bigger factor that affects viscosity compared to particle size μm variations alone.
Direct Effects of Particle Size on Part Quality
Surface Finish and Dimensional Accuracy
Finer powder particles produce smaller molding defects, better surface finish, and increased melt viscosity during injection [7]. The particle size in microns relates directly to achievable surface quality, as smaller particles fill mold cavity details more completely. Research on microstructured parts showed that feedstocks with 10 μm particles ensured complete filling within microtextures for all mold variations. Particles of 22 μm showed decreased filling capabilities in 50 and 100 μm features. This size-dependent filling behavior affects dimensional precision across different feature scales.
Proper particle size selection improves shape retention. Micropillars produced with 200 μm cavities expressed better shape retention than those replicated in 50 and 100 μm cavities. So particle size must scale proportionally with feature dimensions to maintain dimensional accuracy throughout the molded geometry.
Density Uniformity in Sintered Parts
Powder particle size in MIM determines pore characteristics in sintered components. Finer starting particles generate finer, more uniformly distributed pores. Coarser powders create larger pores with irregular distribution patterns. A specimen produced from 15 μm powder achieved higher sintered density compared to 45 μm powder, attributed to better moldability and boosted sintering activity from finer particles.
Volume fraction of coarse particles inversely affects final density. Increasing coarse particle content decreases sintered density and hardness due to increased occurrence of irregular particles. Tailored particle size distributions can reduce raw powder costs without compromising sintered properties when optimized properly.
Shrinkage Control During Debinding and Sintering
Fine powders below 20 μm provide higher surface energy and boosted sintering activity. This leads to more uniform but greater volumetric shrinkage. Linear shrinkage ranges from 15-20% during sintering. Coarser powders above 20 μm show lower shrinkage rates but produce less predictable dimensional changes and increased porosity.
Specimens produced from smaller particle sizes show higher shrinkage levels. Finer particles possess larger specific surface area and necessitate greater binder content. This increased binder volume translates directly to more pronounced dimensional reduction during thermal processing stages.
Defect Formation from Oversized Particles
Particle size distribution width affects defect occurrence in final parts. Powders with narrow distributions boost flow characteristics and reduce defects such as voids and sink marks. Uniform packing density achieved through ideal particle size distribution minimizes defects like cracks and segregation during sintering.
Tensile properties improve as particle size decreases, attributed to increasing hardness with finer particles. Specimens from 45 μm powder showed inferior properties compared to minimum standards. Finer particle sizes produced acceptable mechanical performance.
Particle Distribution Impact on Mechanical Strength
Packing Density and Void Minimization
Mechanical performance in MIM parts begins with how particles arrange themselves before sintering. Bimodal powder mixtures demonstrate measurable advantages over single-size distributions. They improve packing density by 8.2% and flowability by 10.5%. Small particles fill interstitial voids between larger ones and create denser green parts that translate to improved sintered density of 4.0% while reducing sintering shrinkage by 6.4%. Finer particles exhibit packing characteristics that improve green density and directly increase component strength. Higher packing density minimizes voids, maximizes density, and reduces the binder requirement.
Interparticle Contact Area During Sintering
Particle fusion during thermal processing occurs through multiple mechanisms that depend on particle size μm specifications. Sintering initiates with neck formation at point contacts between particles. Intermediate stage densification follows, where pore volume decreases significantly. Pore geometry changes through closure, isolation, and migration during the final stage. Surface diffusion drives atoms along particle surfaces toward contact zones, while grain boundary diffusion occurs as particles grow together. The relative contribution of each mechanism varies based on particle size distribution, temperature, and time.
Grain Structure Formation from Fine vs Coarse Particles
Tensile properties respond to porosity levels rather than grain size or microstructural phase fractions. Coarser microstructures resist sintering more than fine structures, which potentially hinders densification despite improved initial packing from bimodal distributions. Specimens produced from optimized particle size distributions achieve higher sintered density through improved moldability and superior sintering activity.
Tensile Strength Correlation with D50 Values
An inverse relationship exists between tensile strength and particle size in powder particle size in MIM applications. Smaller particle size increases strength in both as-sintered and heat-treated conditions. Powder distributions that eliminate oversized particles achieved tensile strength of 938.7 MPa, hardness of 345.2 HV, and elongation of 22%.
Measuring and Controlling Powder Particle Size Distribution
Laser Diffraction Analysis for Size Distribution
Accurate powder particle size measurement starts with selecting appropriate analytical methods. A powder particle size analyzer using laser diffraction measures angular variation in light intensity as a laser beam passes through dispersed particles. Large particles scatter light at small angles relative to the laser beam. Small particles scatter at large angles. The system calculates size distribution using Mie scattering or Fraunhofer diffraction theory.
Laser diffraction covers particle sizes from 0.010 µm to 2 mm for dispersions. Powder samples are measurable between 0.4 µm and 2 mm. This wide dynamic range makes laser diffraction the de facto standard for metal powder industries in outgoing QC certification and incoming verification. Measurements generate results in less than a minute with high repeatability. Large numbers of particles are sampled in each measurement. The technique requires no calibration and follows ISO 13320 standards.
Dynamic Image Analysis for Shape Verification
Dynamic image analysis captures physical properties of individual particles. Laser diffraction measures collective diffraction patterns. The technique identifies oversized particles, agglomerates and irregular shapes that affect powder particle size in MIM performance. Digital cameras with special optics capture particles streaming through the measuring volume. They determine size and shape descriptors for each particle.
Dynamic image analysis measures both suspended and free-falling particles with a size range of 0.8 µm to 8 mm. Analysis completes in 1 to 3 minutes and allows high sample throughput for continuous quality control. The method proves more relevant than microscopy by measuring particle populations that are by a lot larger.
How to Measure Particle Size Distribution of Powder Samples
Sample preparation determines measurement accuracy. Wet dispersion units use aqueous or solvent-based liquids to suspend samples and recirculate them through the measurement zone. Dry powder dispersion units suspend samples in flowing gas streams, which is dry air in most cases. The entire sample passes once through the measuring zone. Rapid data capture at speeds up to 10kHz will give representative measurements for dry samples.
Reporting standards recommend measuring samples at least three times. Mean, standard deviation and coefficient of variation should be calculated. D10, D50 and D90 values based on volume distribution represent the most common format for expressing laser diffraction results.
Quality Control Specifications for MIM Production
Quality control in MIM production relies on consistent particle size μm verification for incoming powder batches. Manufacturers with nearly 20 years in the industry establish tight specifications for D50 and D90 values to keep feedstock uniform. Particle size distribution affects material fluidity during molding and residual binder amounts during degreasing. Final part evaluation has density measurements using relative density ratios. These compare molding material density to solid metal. High-quality MIM parts exhibit relative density values exceeding 90% and require precise dry density measurement techniques.
Conclusion
Particle size distribution is the foundational variable controlling every aspect of metal injection molding success. The narrow specification window between 1 and 22 μm determines feedstock flowability, mold filling capability, sintered density, surface quality and mechanical strength directly. Manufacturers must implement measurement protocols using laser diffraction and dynamic image analysis to maintain consistency in production batches of all types. Control over D10, D50, and D90 values translates to predictable shrinkage and minimal defects with strong tensile properties. Companies with unique experience understand that investing in powder characterization and quality control creates the foundation for delivering components that meet demanding global specifications.
FAQs
Q1. What is the ideal particle size range for MIM powder? MIM processes typically require powder with particle sizes ranging from 1 to 22 μm, with most applications demanding an average particle size of 20 μm or less. The median size (D50) is usually around 10 microns, with 90% of particles (D90) measuring between 20 and 30 microns. This fine specification ensures proper feedstock flow and complete filling of mold cavities.
Q2. How does particle size affect the final density of MIM parts? Finer powder particles produce higher sintered densities in MIM parts, typically achieving 95% to 99% density. Smaller particles create more uniform packing arrangements and possess higher surface energy, leading to enhanced sintering activity. In contrast, coarser powders result in lower densities with increased porosity and less predictable dimensional changes.
Q3. Why are spherical particles preferred in metal injection molding? Spherical particles deliver superior flowability and higher packing density compared to irregular shapes. They exhibit better flow properties through complex mold geometries during injection and promote optimal inter-particle friction, helping parts maintain their shape during debinding. Spherical morphology also ensures cleaner particle surfaces, preventing contamination during sintering.
Q4. What measurement techniques are used to analyze powder particle size distribution? Laser diffraction analysis is the industry standard, measuring particle sizes from 0.4 μm to 2 mm by analyzing how particles scatter light at different angles. Dynamic image analysis complements this by capturing individual particle images to verify shape and identify oversized particles or agglomerates. Both methods provide rapid results, with measurements completing in 1-3 minutes.
Q5. How does particle size distribution impact mechanical strength in MIM parts? Smaller particle sizes directly correlate with increased tensile strength and hardness. Finer particles create higher packing density, minimize voids, and provide greater interparticle contact area during sintering. Parts made from optimized fine powder distributions can achieve tensile strengths exceeding 938 MPa with improved elongation properties compared to coarser powder alternatives.